A Novel Dataset for the Prediction of Surface NO2 Concentrations from Remote Sensing Data
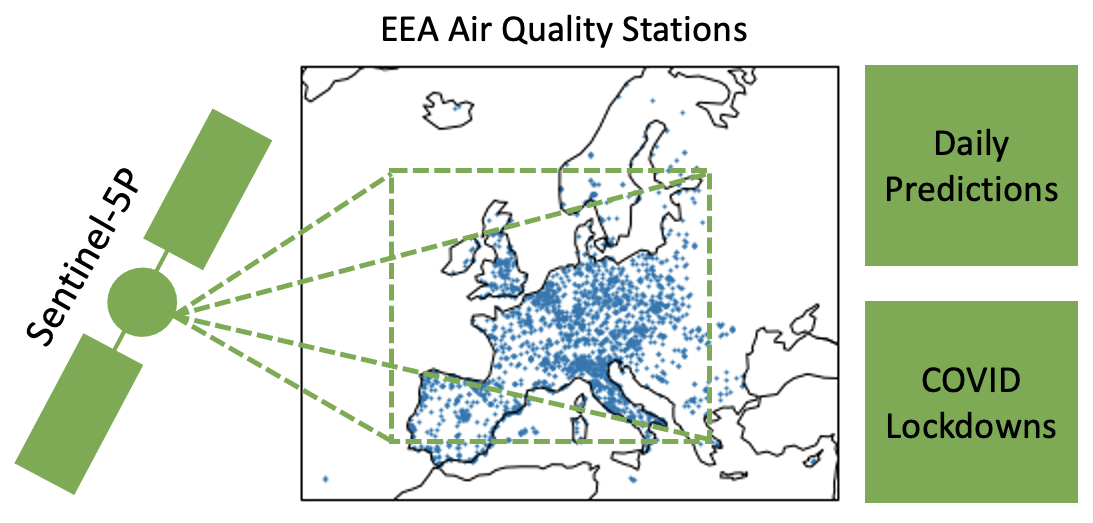
NO2 is an atmospheric trace gas that contributes to global warming as a precursor of greenhouse gases and has adverse effects on human health. This work present a novel dataset of NO2 measurements from air quality stations on the ground, temporally and spatially aligned with NO2 measurements from space by the ESA Sentinel-5P satellite. Additionally, geographic and meteorological variables as well as information on lockdown measures are included. The dataset offers access to diverse data on NO2, and facilitates data-driven research into the dynamics of NO2 pollution.
We showcase the value of the dataset with two applications. Firstly, the prediction of surface NO2 concentrations with gradient boosting which enables the identification of EU NO2 exposure limit breaches. Secondly, we investigate the influence of COVID-19 lockdowns on air quality in Europe and find a significant decrease in NO2 levels when lockdown measures are in place.
Surface NO2 Prediction
Using a gradient boosting approach, the dataset facilitates prediction of surface NO2 with good accuracy and at high temporal frequency. When predicting NO2 concentrations at locations with ground based air quality stations, the boosting approach reaches an R2-score of 0.7 for annual and 0.55 for daily frequency, respectively.

Lockdown Impact Quantification
The analysis of NO2 levels before and during lockdown measures due to the COVID19 pandemic reveals a drop in NO2 across Europe when strict lockdown measures such as stay-at-home orders are in place. For the example of Spain the surface NO2 concentration during lockdown (14.03.2020 to 03.05.2020) decreased by 48% compared to the previous year. Similarly, the average tropospheric NO2 column density decreased by 40%.
